Jace Shuler, a junior math major at Boston College, started a study of Mono Basin glaciers when he worked at the Mono Lake Committee this summer. This post was written by Jace.
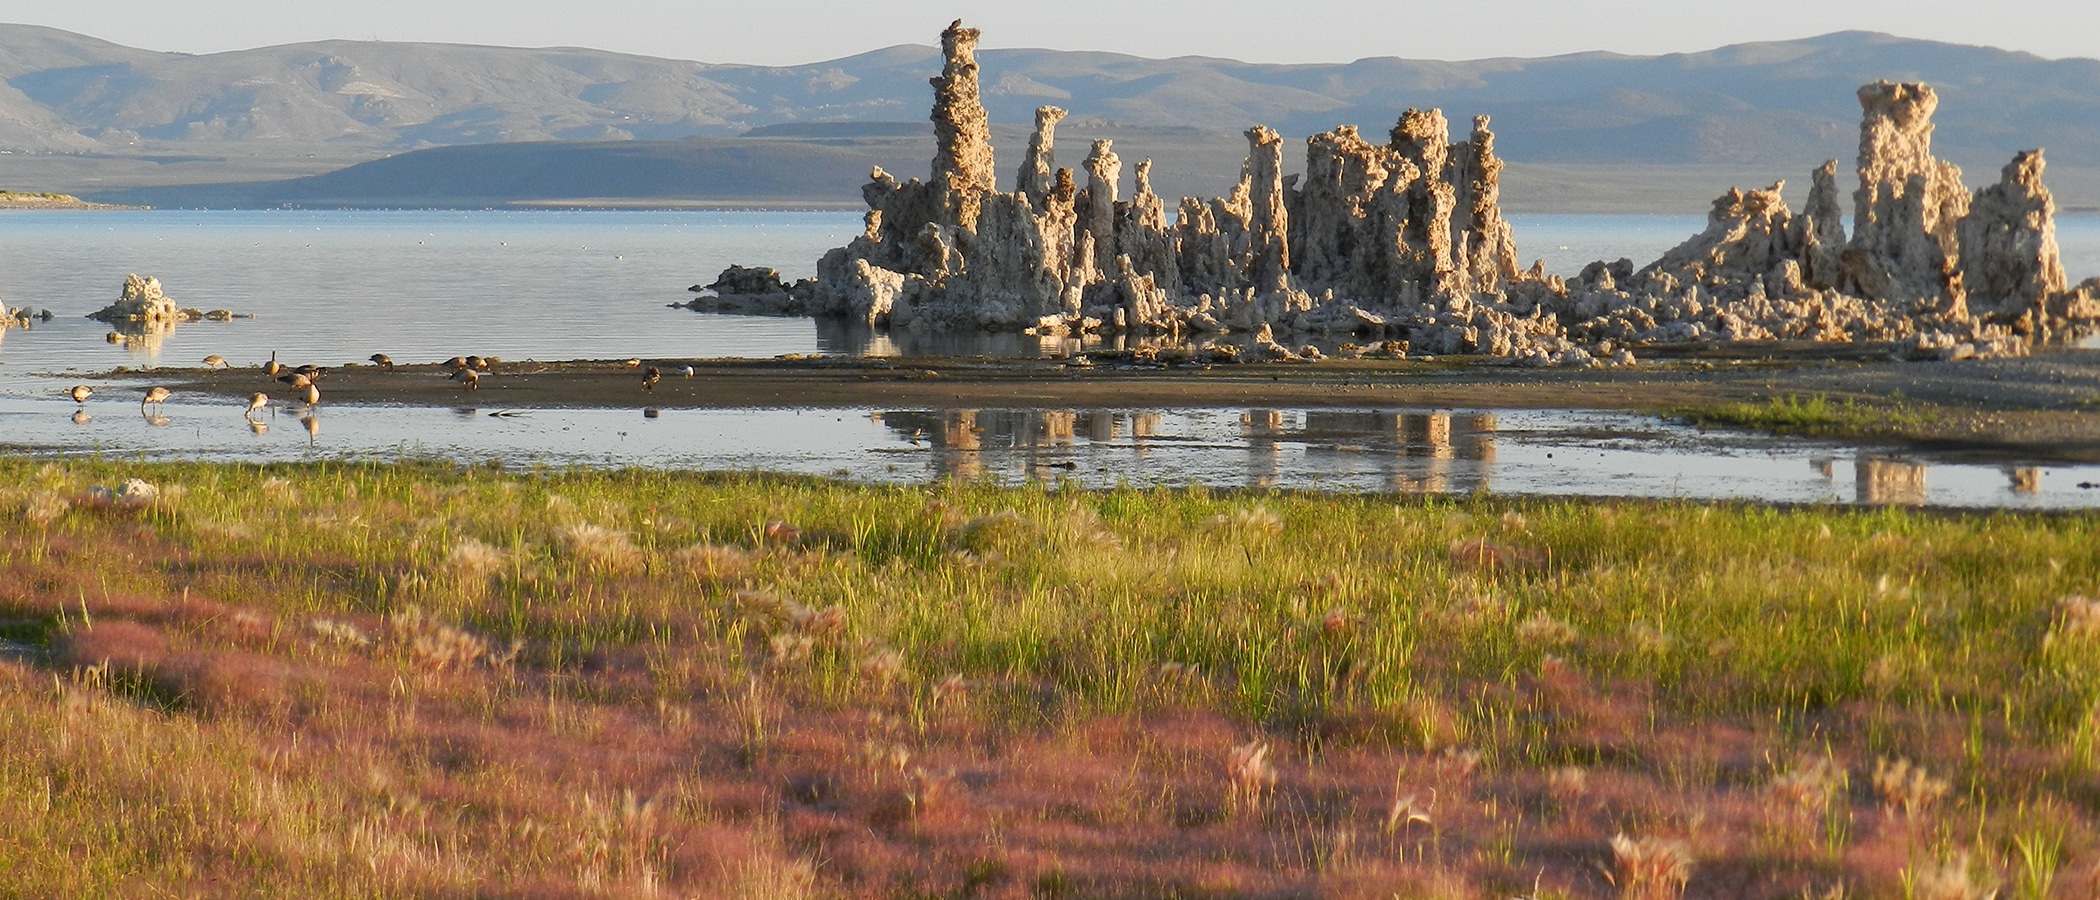
When I tell people that I spent the summer studying and mapping the glaciers in the Mono Basin, the question I always seem to get is, “There are glaciers around Mono Lake?” The short answer is, yes, there are, and they are of great interest to the Mono Lake Committee.
The first step of my project with the Committee was to identify what exists in the area, both in terms of glaciers and data about those glaciers. From there, I would map the glaciers through time to document how they have changed. The Committee could then add to the data each year, which would allow them to forecast the lifespan of the glaciers and predict the effects that their melting may have on the ecosystems of the Mono Basin. Another goal of the project was to educate the public on the glaciers of the area and why they are important. Hopefully, fewer people will be surprised to hear that there are indeed glaciers in the Mono Basin.
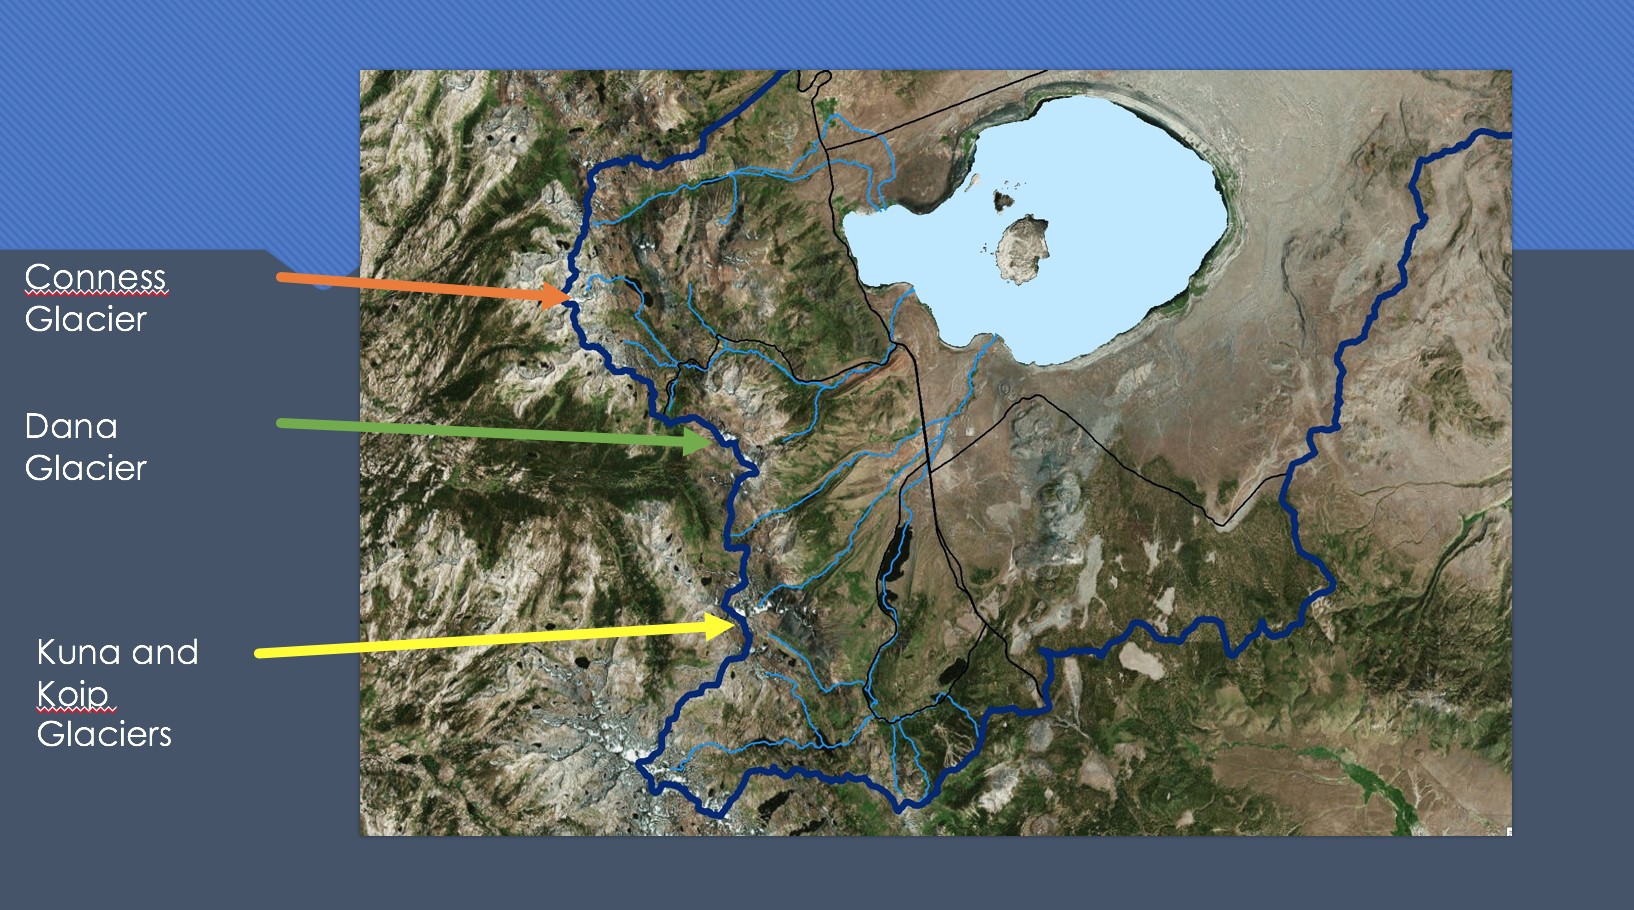
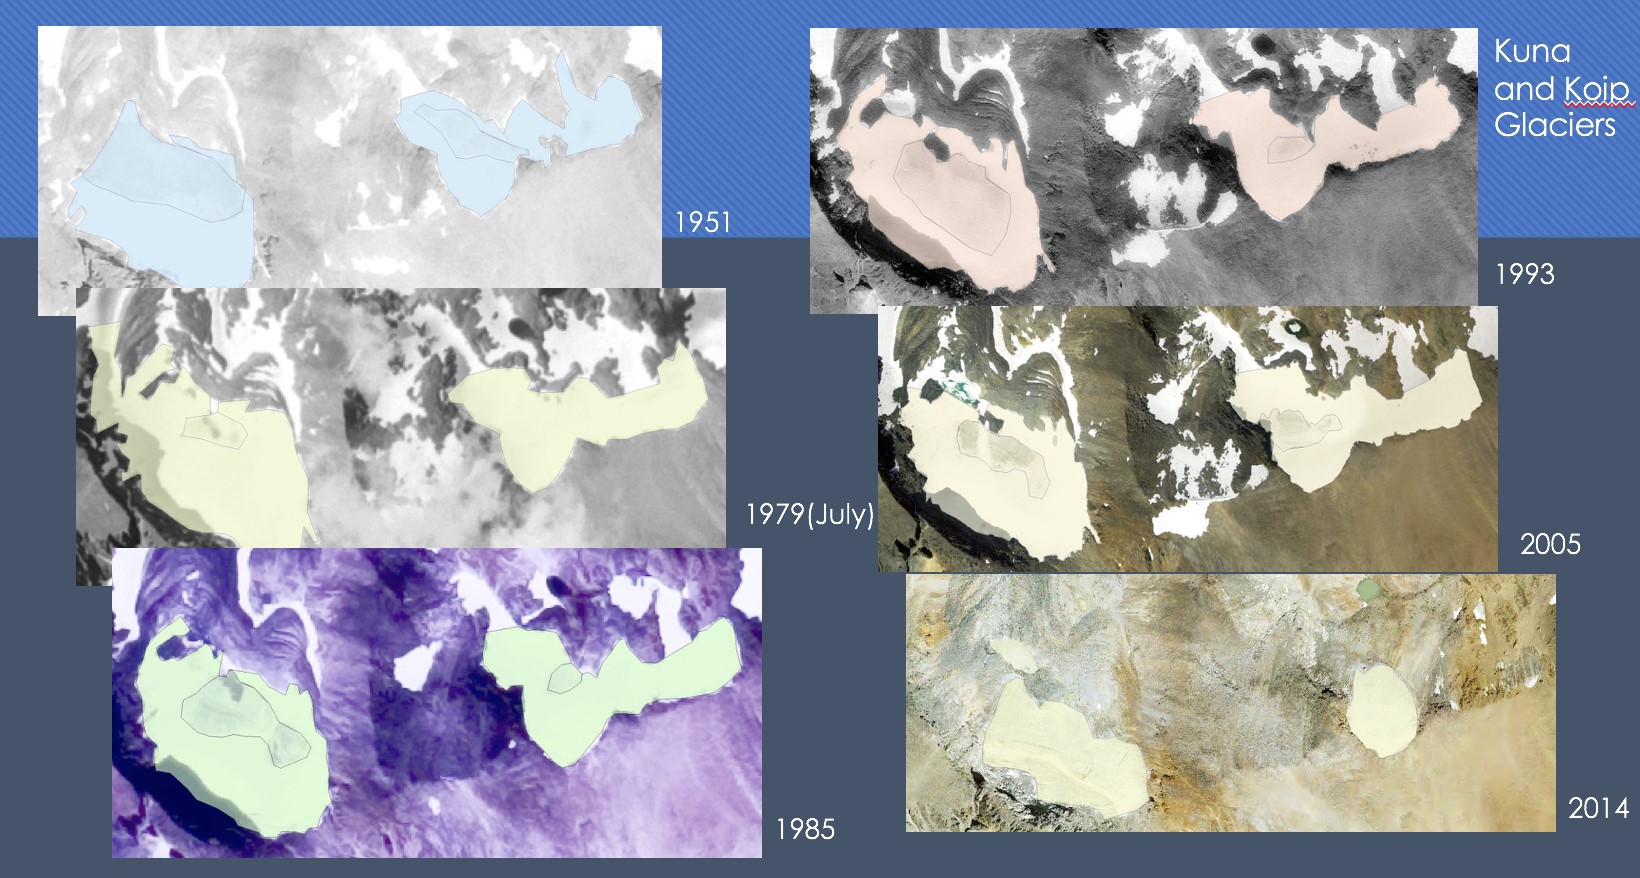
I focused on the four main glaciers of the region: Conness, Dana, Kuna, and Koip. My initial research led me to a glacier database from the National Snow & Ice Data Center and Land Cover Data from the US Geological Survey (USGS). While these were helpful, the best resources were aerial photos. Focusing on the four main glaciers, I downloaded about a hundred aerial photos from the USGS Earth Explorer website. Overall, the photos are from six different sources and go back to 1951. These sources were the best for the project because the specific shape and location of each glacier are clearly visible, whereas the glacier database and land cover database provide only estimates.
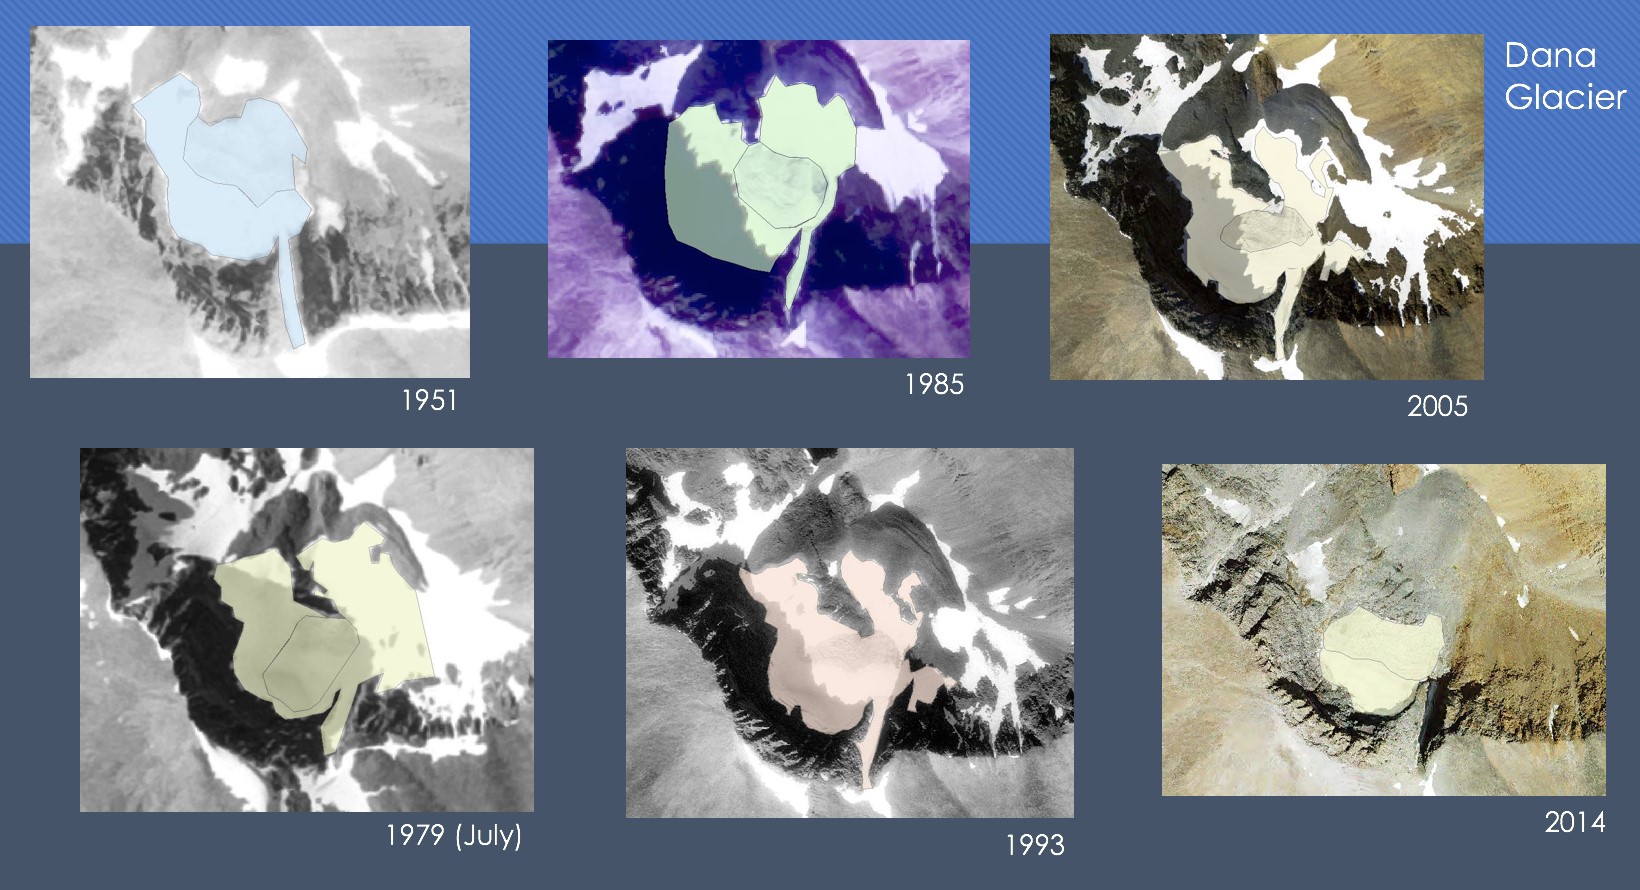
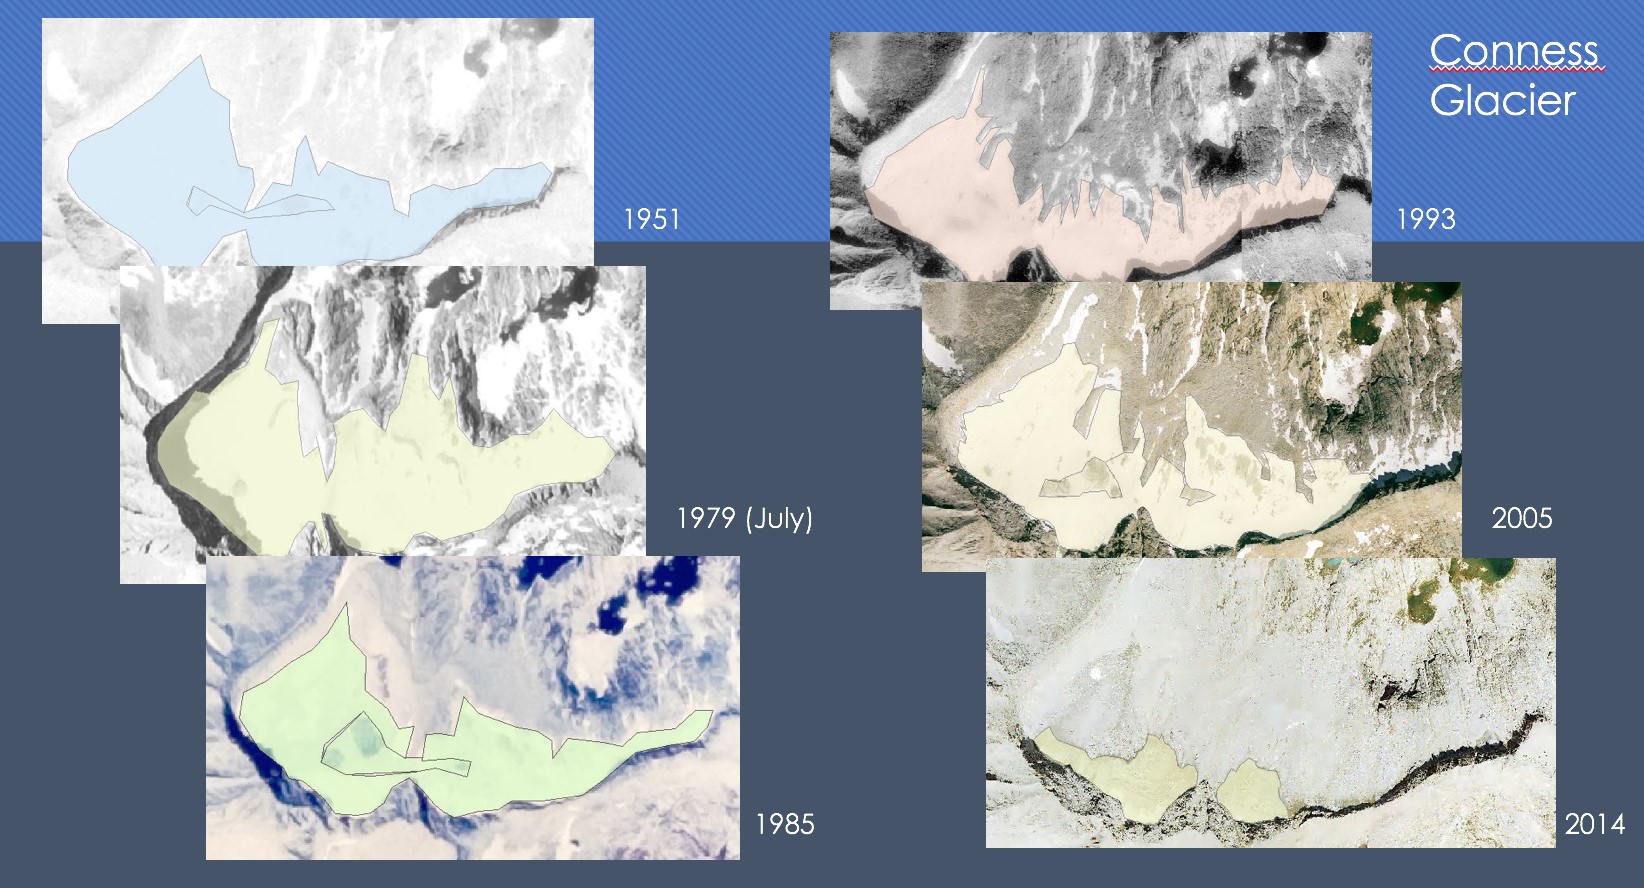
Once I had the aerial photos from various years, I put them into Esri’s ArcGIS software. All photos from 2005 or later were already georeferenced, meaning that when I added them to ArcGIS they were in the correct place geographically. For those photos that were not, I used control points to match up known locations, such as lakes or roads. From there, I traced the glaciers, distinguishing between what was clearly glacial ice and snow that was likely covering ice. The end result were drawings for each glacier for each of the following years: 2018, 2014, 2005, 1998, 1993, 1987, 1985, 1984, 1979, 1968, and 1951. Using ArcGIS, I then calculated the area of each shape to get an estimate of the actual surface area of each glacier.
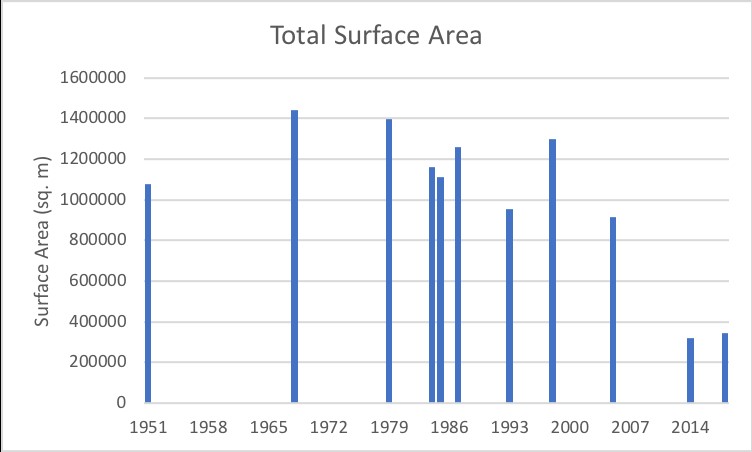
Using the surface area calculations, I was then able to analyze how the glaciers have changed over time. I made graphs for the total surface area of all glaciers for each year, as well as graphs for each individual glacier. It was here that I encountered some interesting questions. For example, for every graph the surface area fluctuated; in some places, it increased from one year to the next. As it is highly unlikely that ice can suddenly return to a glacier, possible explanations include the time of year the photo was taken, potential distortion of the photos after georeferencing them, or above-average snowfall the previous winter persisting and making the glacier seem larger. With respect to the first possibility, Yosemite National Park geologist Greg Stock recommended that I avoid photos taken in July because the previous winter’s snow may not have completely melted. Indeed, when I removed data from July, the graphs displayed less fluctuation. Still, 1998 showed a spike in all graphs, which is likely due to four straight years of above-average snowpack affecting the ability to determine the edge of the glacier.
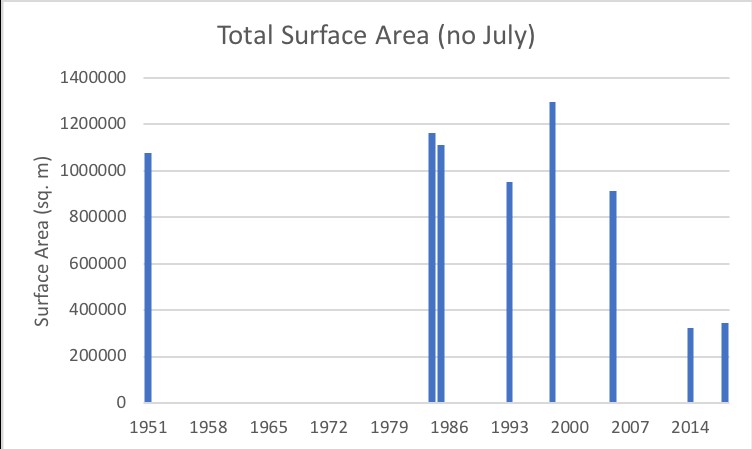
Regardless of fluctuation, there is one trend that is impossible to ignore: the steep decline between 2005 and 2014. The total surface area decreased by 65%—Conness by 74%, Dana by 60%, Kuna by 43%, and Koip by 73%. At this rate, the glaciers may disappear well within our lifetimes. This provides a more complete answer to the question about glaciers in the Mono Basin: yes, there are glaciers, but maybe not for much longer.
Despite the grim future of the Mono Basin’s glaciers, this project is far from over. We now have a collection of aerial photos that show the glaciers over time and can be used to educate the public about them. Furthermore, we can add to this collection as more photos are taken in subsequent years, which will then allow us to make more surface area calculations. Another possibility is to work towards quantifying the three-dimensional shapes and volumes of each glacier, both past and present.
Overall, this new information about the Mono Basin’s glaciers will provide more understanding, both among the public and among policymakers, about the region’s ecosystems and how climate change is affecting them. People will no longer ask, “Are there glaciers in the Mono Basin?” but rather, “What can we do to save them?”