Just how much water is contained in the Sierra Nevada snowpack? NASA and the Jet Propulsion Laboratory, along with the California Department of Water Resources and the USDA Agricultural Research Service, have developed the high-tech Airborne Snow Observatory (ASO) to answer that question with greater precision and clarity than ever before.
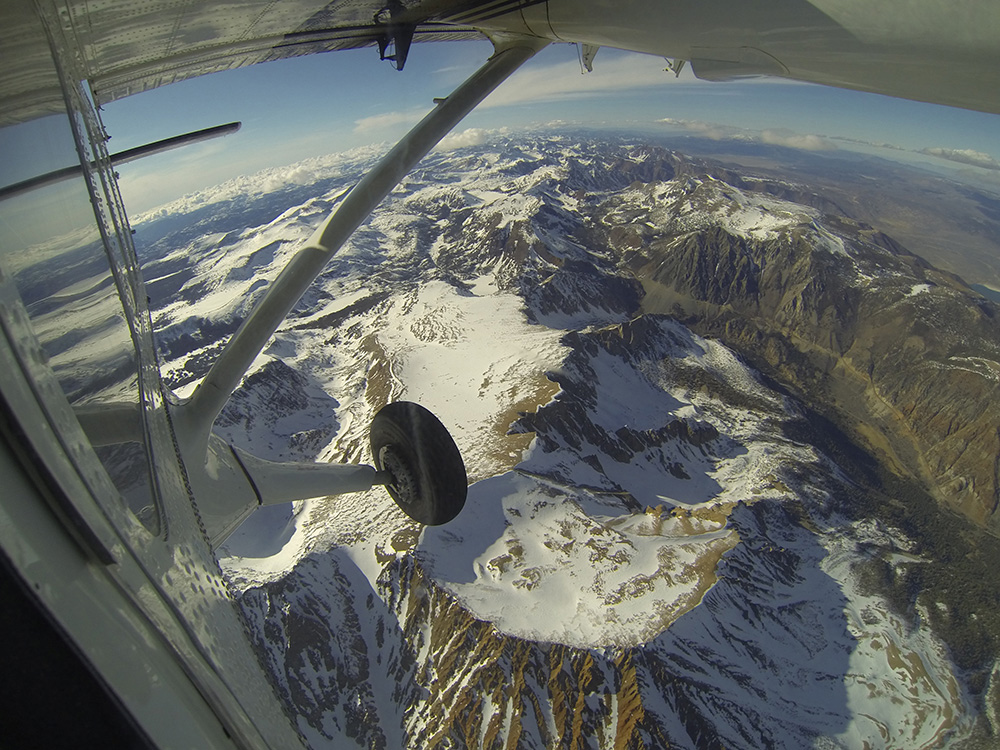
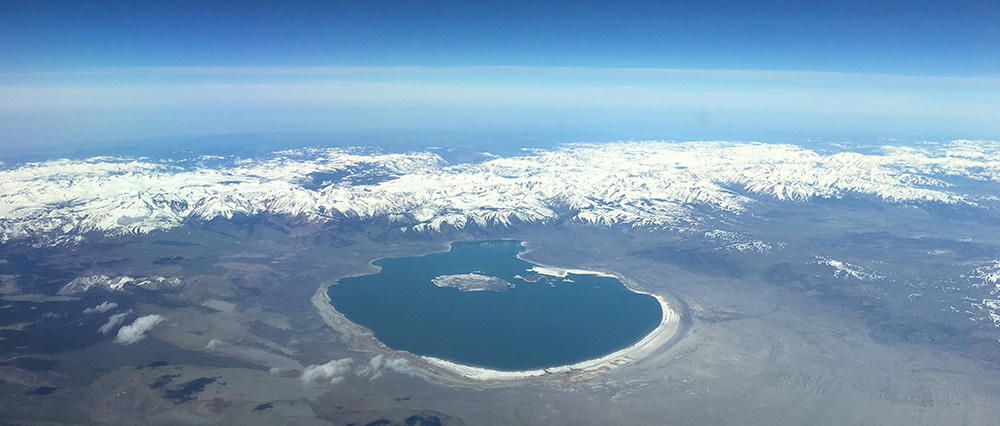
Flying out of nearby Mammoth Lakes, a plane equipped with an imaging spectrometer and an incredibly precise LIDAR laser measurement system has been gathering vast quantities of data that allow scientists to calculate how much water is contained in every square meter of snowpack in the high Sierra. Knowing how much water is stored in the snowpack and waiting to flow down Rush Creek, for example, is incredibly valuable. The details of how ASO works are fascinating and the big-picture implications for Mono Lake and all of California water management are exciting. I talked with ASO Principal Investigator Dr. Tom Painter in May during a break in his schedule between flights, project development, and a roster of presentations worldwide.
Geoff: Thanks for taking time to talk, Tom. We’re just coming out of a huge winter; how notable was it from your perspective?
Tom: For me the coolest thing has been to be in the lucky position with ASO to quantitatively document “Drought-orama” to “Snowpocalypse.”
We could evaluate that transition during the three-week period when we had the big atmospheric events in January. Using our ASO data and combining it with satellite retrievals and some modeling results with colleagues at the University of Colorado, we found that 25% more water than the entire annual flow of the Colorado River fell onto the Sierra Nevada as snow, just in those few weeks.
That’s amazing—an atmospheric river compared to a traditional river—you can see this kind of thing because ASO is measuring total water in the snowpack, right?
Exactly. It was a pair of atmospheric river events that came and dumped that much water—25% more than the average year in the Colorado River basin, which is in seven different states—and it all came to the Sierra. It was just absolutely stunning.
And what we’ve been finding in the Central Sierra is that the accumulation of snow and then the redistribution has put us in a place where we have tens of meters of snow in places.
What is snow redistribution?
Redistribution is avalanching, blowing, and wind scouring of the western slopes up and over onto the eastern side. Snow doesn’t just sit all winter where it falls, it’s incredibly dynamic in the high country. The cool thing is that Mono Lake benefits a lot from wind redistribution and scouring. You can see it from the satellite views and the ASO data. Up high in the mountains the west aspects tend to be bare and their snow has blown in the wind and sublimated or been deposited on the east side. It drops down and becomes part of the melt for Mono Lake and the Owens Valley in summer.
So we should feel a little better in Lee Vining when these winter storms blow in that give us a lot of wind but little precipitation—because up high the wind is augmenting the Mono Basin snowpack?
That’s right. In this year, those accumulations from snowfall and redistribution are in depths of 60, 70, 80, 90 feet. It’s unbelievable. All over—in the upper Rush Creek watershed, San Joaquin, the Lakes Basin in Mammoth.
So that’s about the height of a nine-story building. Do we have any buildings that tall in Mono County?
Nope. The wind is the biggest builder. And during the height of the winter it put snow just everywhere across the landscape.
Is the redistribution, which ASO can measure, one of the ways ASO is going to the next level of snow measurement, compared to the traditional fixed point measurement sites?
Yes, that’s one part of it. Here’s another important element: The measurements historically have been automated snow pillow sensors and snow courses measured each spring by snow surveyors, which tend to be at lower- to middle-elevations—they sit in the 8,000–10,000 foot range. Up higher we are as blind as can be.
And what is the history of that? Rugged terrain up high?
It’s hard to get to the higher elevations, but the big reason is that historically there has been enough accumulation in those middle elevations that you could index off of that—leverage that information to get a pretty good handle on what the total summer runoff was going to be.
But those were also established at a time when the population of California was less than half what it is today. And even though the water rights were all nailed down, the stress on the state water system was lower. There was more flexibility. There was less population demand for water, less agricultural need, fewer river flow and environmental protections. You could be 20–40% off in the runoff forecast and it wasn’t that big of a deal. Now if you are 40% off it is a huge deal because the water is more precisely allocated and one resource or another downstream is going to lose out when the forecast is wrong. So there used to be more latitude with water management, and that has been going away.
If we didn’t have climate change that would still be the case. But we do have climate change, and that is really why we have to adapt. With the changing climate those index sites themselves—the snow pillows and snow courses—are becoming less reliable. So let’s say you are a water manager and you extrapolate from your watershed’s suite of snow pillows and snow courses to determine how much snow water equivalent there is, or how much runoff there will be from April through July. That relationship is becoming less robust. It’s not just that the relationship is changing due to climate change, it is also becoming less reliable and less accurate overall. That’s why the state of California and the Department of Water Resources have invested in new methods to determine how winter snow is distributed across the landscape. There are advanced mathematical tools out there but they still rely on the snow pillows and snow courses. The way to really do this is through the Airborne Snow Observatory—and once you have ASO, you don’t need to extrapolate or rely on regressions and their inability to get every year right. You just get the straight-up measurement of how much water equivalent is in the snowpack. Period.
People have asked us over and over “what percentage of normal are you seeing” and we’ve only been flying for five years so there’s no long-term average for us to reference. But we say back: would you like to just know how much water there is?
I remember the first data you sent us for Rush Creek. Along with the map of distributed snow water equivalent, there was just a text file with a number. We are so unaccustomed to a direct answer about the snowpack—it’s always extrapolated percentages of average, or scenario this and scenario that. ASO just gave us the direct answer to how much water was sitting in the upper watershed snowpack.
And people often don’t know what to do with that. They say it is the exact data they want but they don’t know what to do with it, they’ve been relying on percentages for so long. But once they adapt their water planning system, as the Tuolumne watershed folks have done, it makes a huge difference in accuracy.
So what is the accuracy of ASO? How does actual measured runoff in streams and rivers compare to the numbers ASO is producing?
Here’s the point of reference: At the American River, Dr. Jeff Dozier from the Bren School at UC Santa Barbara has studied the probability of forecast error over a 20-year period for April–July runoff. What that analysis shows is that in 50% of the years the forecast error was 20% or greater. In one of five years the error was greater than 40%. There are lots of reasons for that that hydrologists talk about, but the analysis we’ve done in the Tuolumne shows that large size forecast error using the current tools and methods is most likely due to the uncertainty of the spatial distribution of the snowpack. You’ve got these index sites—the snow pillows and snow courses—and they are telling you, kind of, how much snow you have, but they can mislead you. It’s not that forecasters are making mathematical errors, it’s that they have no data on the high-elevation distribution of snow. It’s like walking into a restaurant with 200 people and asking four of them what the best food is. You’ll get an idea, but not a definitive answer.
The analysis on the Tuolumne shows that the distribution of snow changes all the time. You can’t correct your forecast tools to account for that. You just have to measure what is really there in the snowpack and that’s why ASO is so valuable—we measure it all. For the analyses we’ve done so far of the accuracy of the runoff numbers ASO is generating, the R2 values we get are about 0.98 with all the years on the plot. Which is to say the ASO measurements of snow water equivalent are extremely close to actual runoff. It’s a huge leap forward in accuracy.
What makes Mono Lake and the Mono Basin interesting for ASO?
At Mono Lake the playing field is leveled, the rules are known. You aren’t arguing over uncertainty. At least in the case of the snowpack, in terms of quantifying the relationship between the watershed and Mono Lake, those relationships are established. That makes the ASO data more meaningful because the Committee and the Los Angeles Department of Water & Power can work directly with more specific data and accurately project and plan what will happen downstream and at Mono Lake. Not to mention that it solves problems like the ongoing inaccuracy of the key Gem Pass snow pillow, and the reduction in the number of snow course measurements being made in the Mono Basin watershed in the last two decades.
Our California civilization is built up around this water resource that is the snowpack. And the ecosystems and environments that support us are critical for the long haul since we are so reliant on that resource. To be able to get rid of the uncertainty, so we can make the right decisions, to me is the kind of contribution I want to make. And I’m excited that we are doing it for Mono Lake and for all the Sierra Nevada.
This post was also published as an article in the Summer 2017 Mono Lake Newsletter (pages 6, 7, and 24).