A few common questions we hear at the Mono Lake Committee include, “How is the lake doing?” “How much has the lake risen since I last visited?” and “How much has the lake come up this year after the big winter?”
I wanted to make a tool so everyone could have an easy, interactive way of learning about Mono Lake’s changing level. Now, you can simply select a month and year and this tool will tell you the lake level for that month and how it compares to Mono Lake’s current level. Try it out below!
For example, when you look up December 2022, Mono Lake’s previous low point, the tool will tell you that Mono Lake is 4.8 feet higher today, standing at 6382.2 feet above sea level. I also looked back at how the lake level has changed since I started working at the Committee in June 2015—the lake currently stands more than four feet higher.
I hope you’ll use this tool to see how the lake level has changed since the first time you saw Mono Lake, or the last time you visited. We’ll update it every month so you can easily track Mono Lake’s level over the months and years, from April 1941 to today. Feel free to post your findings in the comments of this post—I’d love to hear your stories of seeing Mono Lake change over the years.
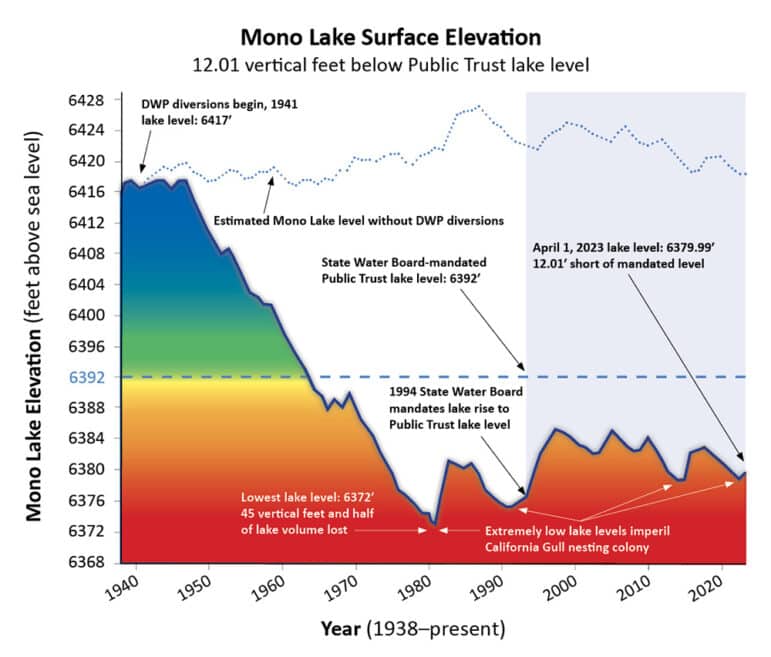
About the graph
DWP’s stream diversions caused Mono Lake to lose half its volume and fall more than 45 vertical feet, negatively affecting the Mono Lake ecosystem, millions of migratory and nesting birds, salinity, and air quality. Even after the State Water Board mandated that Mono Lake rise to the Public Trust lake level of 6392 feet in order to achieve ecological sustainability, restore damaged resources, and minimize air quality violations, DWP’s stream diversions have continued to keep Mono Lake too low by exacerbating lake level drops during droughts and eroding lake level gains during wet years. Modeled by the Mono Lake Committee.
Top photo by Andrew Youssef.

