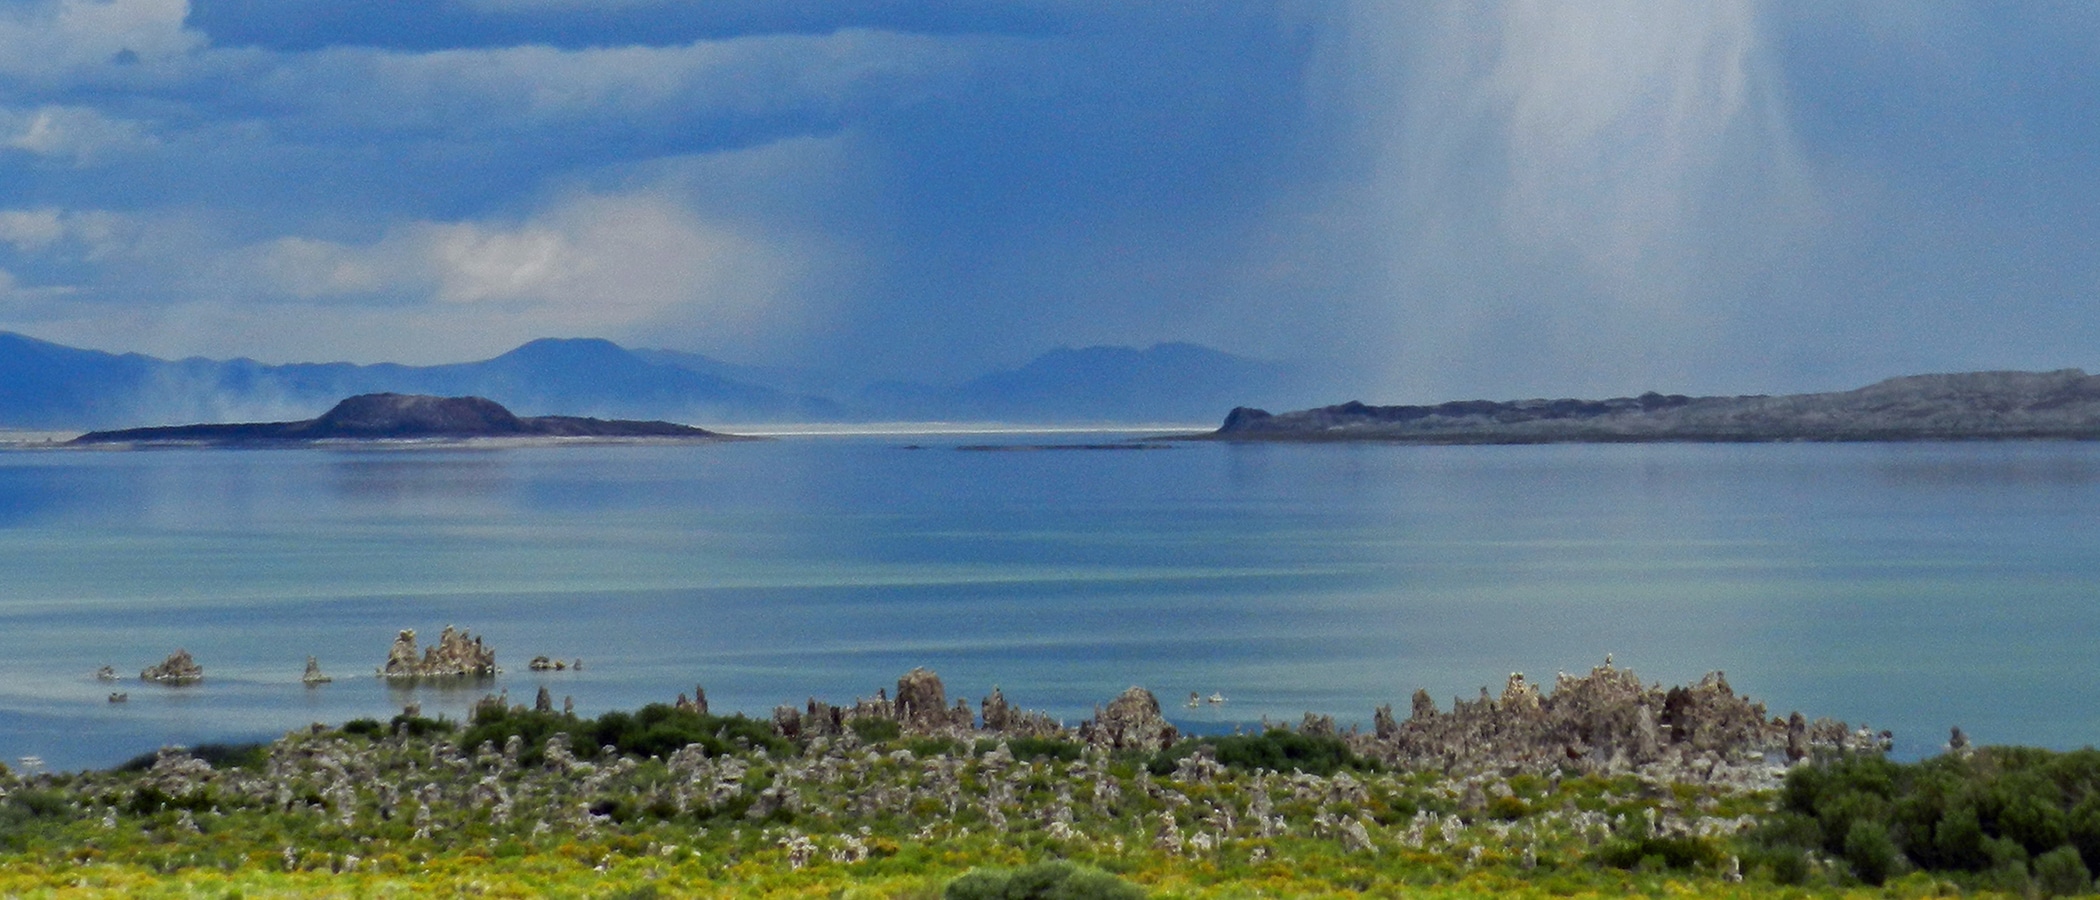
The California State Water Resources Control Board issued Decision 1631 in 1994 to restrict the Los Angeles Department of Water & Power’s (DWP) diversions from Mono Lake’s streams in order to restore the streams and waterfowl habitat and allow the lake’s elevation to rise to a healthy management level of 6392 feet above sea level. The State Water Board projected that Mono Lake would attain the 6392-foot level in an average of 20 years, give or take a decade depending on drier or wetter conditions. This year, 27 years later, the lake level is at 6381′, 11 feet short of the 6392′ management level.
Why is the lake rising more slowly than the State Water Board expected?
The State Water Board’s expectations were based on a hydrological model of Mono Lake’s inflows and outflows that projected the lake’s rises and falls through time. As is standard practice, the model utilized hydrology and climate data from the preceding historical period. The State Water Board was keenly aware that projections are inherently uncertain and was “aware of the limitations of computer modeling hydrologic systems and the probability that future hydrologic conditions may differ significantly from historical conditions.”
How did the model assumptions hold up? With available data from the 26 years since Decision 1631 (1995–2021) we can compare the historical 50-year (1940–1989) hydroclimate that was used in the model projections. Placing these two periods in context of the long-term hydrology record for the Mono Basin, the historical period was slightly wetter than average while the recent period was slightly drier than average.
The following comparison focusing on the four largest components of Mono Lake’s hydrology illustrates how less water was available to the lake than projected and the consequent impact on lake level.
Component 1: Sierra Nevada runoff
Despite the 2012–2016 drought, Sierra Nevada runoff has only decreased slightly—about 2% on average—between the historical (1940–1989) and recent (1995–2021) periods. Although swings between very wet and dry sequences have become more common, the recent period is within the range of historical variability for runoff in the Mono Basin, dating back to the late 19th century.
Because Sierra runoff is the major inflow to Mono Lake—accounting for nearly three-quarters of incoming water—this small deficit adds up over time. A 2% decrease over 26 years is the equivalent of about 85,000 acre-feet of runoff. This volume of water equals roughly two feet of lake elevation and begins to explain why observed lake levels are lower than what was projected.
Component 2: Basin precipitation
Analysis of the precipitation east of the Sierra Nevada indicates a more marked decline. Precipitation at Cain Ranch, southwest of Mono Lake, has decreased 20% between the historical and recent periods, suggesting that snow and rain falling directly on Mono Lake and adjacent land may have significantly decreased. Ongoing analysis of weather stations throughout the region suggests a broader decreasing trend but conclusions remain preliminary.
While basin precipitation contributes far less water to Mono Lake than Sierra runoff, it still accounts for nearly 25% of lake inflows. The precipitation decrease in the recent period could account for a significant reduction in lake inflow and explain upwards of six feet of “missing” lake elevation.
Component 3: Evaporation
Lake evaporation is the primary outflow from Mono Lake. Unfortunately, estimating evaporation from saline Mono Lake is challenging, and long-term records are not available. Preliminary analysis of regional data suggests evaporation rates may have increased marginally between the historical and recent periods. If Mono Lake has experienced a similar increase in evaporation rates, modeled results would have underestimated cumulative evaporation outflow by up to
100,000 acre-feet or roughly two feet of lake elevation.
Component 4: DWP stream diversions
In addition to natural processes, the model incorporated DWP stream diversions and Grant Lake Reservoir operations into its Mono Lake level projections. The model assumed that DWP would be unable to divert all of the streamflow allowed in some years due to operational constraints. Since 1995, however, DWP has been able to fully divert all authorized exports each year. This difference accounts for more than a foot of “missing” lake elevation.
It all adds up
In addition to these four primary water components, other unresolved factors like groundwater recharge also explain why the lake is rising more slowly than expected. The takeaway is that over time, what may seem like relatively small changes in the main components of Mono Lake’s hydrology can add up to hundreds of thousands of acre-feet of water and can explain why the State Water Board expected that their management rules would result in a lake level higher than we see today.
If recent hydroclimate trends remain steady into the future, Mono Lake’s recovery will remain stalled. Because the Board recognized the limits of model projections and anticipated that Mono Lake might rise more slowly than expected, they built in a hearing process to review the rules that govern DWP’s stream diversions—the only part of Mono Lake’s hydrology that can be controlled. While the State Water Board’s requirement to protect Mono Lake by raising it to 6392′ will not change, it’s time to consider whether the stream diversion rules should.
This post was also published as an article in the Summer 2021 Mono Lake Newsletter. Top photo by Sandra Noll.
