The October 1, 2011 to September 30, 2012 water year recently came to a close. Happy new 2013 water year!
What is a water year?
It is said that hydrologists get to celebrate a new year at least four times a year—January 1st for a calendar year, April 1st for a runoff year, July 1st for a coastal California rainfall year (as well as a fiscal year), and October 1st for a water year. Needless to say, this creates challenges in organizing hydrology data.
Here in the Mono Basin, we typically use the runoff year to summarize most measurements involving stream flows, since the Sierra snowpack begins melting on April 1st and the hydropower reservoirs are usually almost empty by the following March 31st. It is the most useful year to use for planning reservoir levels and releases because you can measure the snowpack on April 1st and know how much water you have to work with. The problem with the runoff year is that the summer runoff comes from the previous runoff year’s precipitation, but winter floods mix things up, resulting in hydrology influenced by two winters. 1996–1997 is a classic example of a runoff year that wasn’t that wet for summer runoff, but the annual total runoff would lead you to believe it was much wetter if you didn’t know about the January flood. Data is often broken down by season to solve this problem: April–September and October–March. But which year should October–March fall into?
The water year mostly solves this problem, since beginning on October 1st nicely keeps the year’s precipitation together with any resulting winter floods and the subsequent snowmelt runoff. Since Mono Lake responds to both precipitation and runoff, it makes sense to use either a water year or a runoff year to track its levels. A water year would seem to make more sense, except when wet year reservoir releases (and groundwater inflow) linger into the following year (like last fall). October–December 2011 Rush Creek inflow to Grant Lake Reservoir was 135% of average and releases to Lower Rush Creek were 168% of average—in a dry 55% of average 2012 water year. But it was also in (and very much influenced by) a wet 142% of average 2011 runoff year. The point being that nature is complex and variable, our water management adds additional complexity, and our efforts to categorize and summarize and lump and split often obscure that complexity and don’t always add to our understanding of how the watershed works.
2012 water year totals: precipitation
During the 2012 water year, only 6.2 inches of precipitation fell in Lee Vining—45% of the average since records began in 1989. This was less than any other year except 1991. October and August were the only months with above-average precipitation, and December and May were the only months with no measureable precipitation. The only other time December had no measurable precipitation was 1999—also the only other time Tioga Pass stayed open into January. 2012’s 47% of average snowfall was also the lowest since 1999–2000. The amount of precipitation that fell during the warmer months since April 1st—1.08″—was lower than any year except 1991 and 1993.
At Cain Ranch, where precipitation records go back to 1933, a January power outage prevents knowing exactly what the total was, but I estimate 2012 was the fourth-driest water year after 2007, 1960, and 1968. At Ellery Lake Reservoir it was the third-driest year since 1925 (after 2004 and 1977 with 2007 data missing).
At Gem Lake Reservoir, where data go back to 1925 (and are also missing from 2003–2008), it was the seventh-driest year on record. The interesting thing is that from 1925–1953 there wasn’t a year this dry for 29 years in a row—an example of how extraordinarily wet the early part of the 20th century was. Since 1954, the longest period without a year this dry was only nine years—from 1978–1986, the most extraordinary wet period in our records. Contrast this with almost four inches of rain in August 2012—more precipitation than has fallen in any single month since January 2010!
2012 water year totals: streamflows
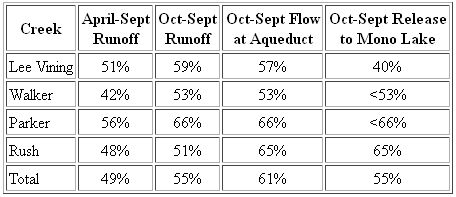
Runoff was 55% of average for the 2012 water year and 49% for April–September. This is consistent with the runoff forecast issued on May 1st for April–September, as well as the 55% forecasted for the April 2012–March 2013 runoff year. Our preliminary runoff estimates are as follows:

Grant Lake Reservoir peaked at 94% of capacity in late May, but it didn’t spill this year. It had a net loss of about 1,800 acre-feet during the water year, partially due to about 3,000 acre-feet of water evaporating from the reservoir’s surface. In September, there was a period of time when this evaporation was quite evident to anyone paying attention to the real-time hydrology data. Grant Lake Reservoir dropped 420 acre-feet despite inflow exceeding outflow by 150 acre-feet. Assuming the preliminary data was correct, this was due to evaporation and seepage—and adds up to approximately 10.5 cfs of evaporation from the 1050 acre surface, or 0.01 cfs per acre, or almost 1/5th of an inch per day! This is a good reminder why reservoirs are like insurance policies—you’ve got to pay for them (in water) even if you don’t need to use them. And some are quite expensive—for example, Powell Reservoir on the Colorado River has such a large surface area that it evaporates more water than all the water used by the City of Los Angeles!
This spring and summer, the snowpack melted the fifth-earliest on record. Parker Creek runoff in April and May was 26% of the April–September total (on average this proportion has increased from 17% in 1935 to 21% in 2009). As a result of the early melt and lack of precipitation, Parker and Walker creek flows reached new lows for July. Preliminary data show that in late July, Walker Creek dropped below 2 cubic feet per second (cfs) and Parker Creek dropped below 10 cfs—perhaps the first time this has happened in July (daily runoff data are missing prior to 1980). Then, due to a rainstorm, Parker Creek peaked on August 19th at 32 cfs—150% of the magnitude of the June snowmelt peak.
2012 water year summary: Mono Lake levels
If you view our compilation of annual Mono Lake levels since 1850, you’ll notice they are all on October 1st. Right in the middle of the runoff year, at the beginning/end of the water year, and close to the annual fall minimum. Mono Lake dropped 1.3 feet since October 1, 2011. This was only the second time since 1989 that the lake dropped more than a foot—the other year was 2007, when it dropped 1.4 feet. Over the last 23 years, it rose at least a foot in eight different years, dropped a foot or less in eight years, and stayed fairly steady (less than a ¼ foot rise or fall) in five years. In 1989, a lake level injunction halted water exports when the lake was below 6377 feet—before then, due to excessive water diversions, the lake fell over a foot in most years.

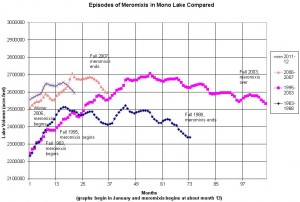
This drop to 6382.4 feet above sea level—about the same level it was in October 2008—is almost certainly going to allow the lake to fully mix this fall and winter, which would result in the shortest period (1-year) of meromixis in the 30-year history of the limnology monitoring program. We eagerly await the results of this winter’s sampling trips out on the lake to confirm this event.
