At the Cain Ranch weather station five miles south of Lee Vining, where precipitation records go back to 1932, the 2020 water year was the third-driest on record. Only 47% of average precipitation, or 4.92 inches, was measured at that location between October 1, 2019, and September 30, 2020 (the 2020 water year). The only drier water years were 1960 and 2007. This year was the first time no precipitation was recorded in February, which contributed to the October–March period being the second driest on record (after 1977).
Precipitation does not fall evenly over the Mono Basin, and at the weather station in Lee Vining the 2020 water year was the fourth-driest since 1989 (after 1994, 2007, and 2012), at only 62% of average, or 8.78 inches. The October–March winter season was the second-driest, only beaten by the even drier 2014–2015 winter. At the higher elevation weather stations of the Mono Basin, in the Sierra at Ellery Lake and Gem Lake, water year 2020 precipitation was 48% and 52%, respectively, of the long-term averages going back to 1925.
April–September runoff
Our preliminary estimates of April–September 2020 snowmelt runoff are in the table below, alongside the Los Angeles Department of Water & Power’s (DWP) runoff forecast.
| % of average | Apr–Sep runoff (acre-feet) | DWP April forecast (acre-feet) | |
| Parker Creek | 75 | 5,464 | 5,800 |
| Walker Creek | 47 | 1,785 | 2,500 |
| Lee Vining Creek | 42 | 17,058 | 25,200 |
| Rush Creek | 51 | 26,269 | 35,400 |
| Total | 49 | 50,577 | 68,900 |
In April we disagreed with DWP’s forecast—we thought it was too high compared to what the available data indicated—and expressed concern that the forecast equations relied too heavily on Parker Creek antecedent conditions. In the end, Parker Creek runoff, at 75% of average, was close to the forecasted volume, but the other creeks were much lower (42–51% of average runoff). While the impact of the mis-forecast was minimal this year, there are years (such as 2003 and 2008) when the impacts on Rush Creek flows or Grant Lake Reservoir levels can be significant.
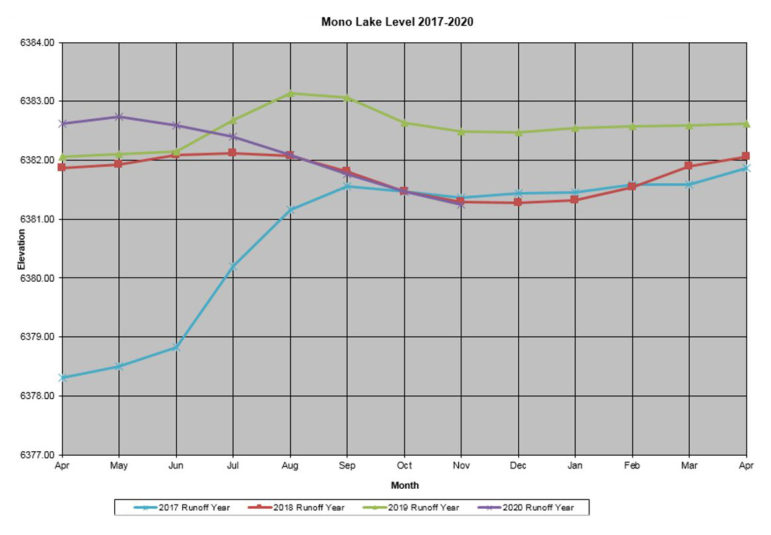
Mono Lake level
Remarkably, the 1.17-foot rise in Mono Lake in the 2019 water year exactly matched the 1.17-foot drop in lake level during the 2020 water year. When combined with no net change during the 2018 water year, Mono Lake’s October 1st level was the same in 2017, 2018, and 2020. This is evident in the runoff year (April 1–March 31) graph below (the runoff year is used to apply the rules in State Water Board Decision 1631). The seasonal fluctuations in Mono Lake’s level are evident in this graph, and you can also see that Mono Lake’s levels in August–October during 2018 and 2020 were essentially the same.
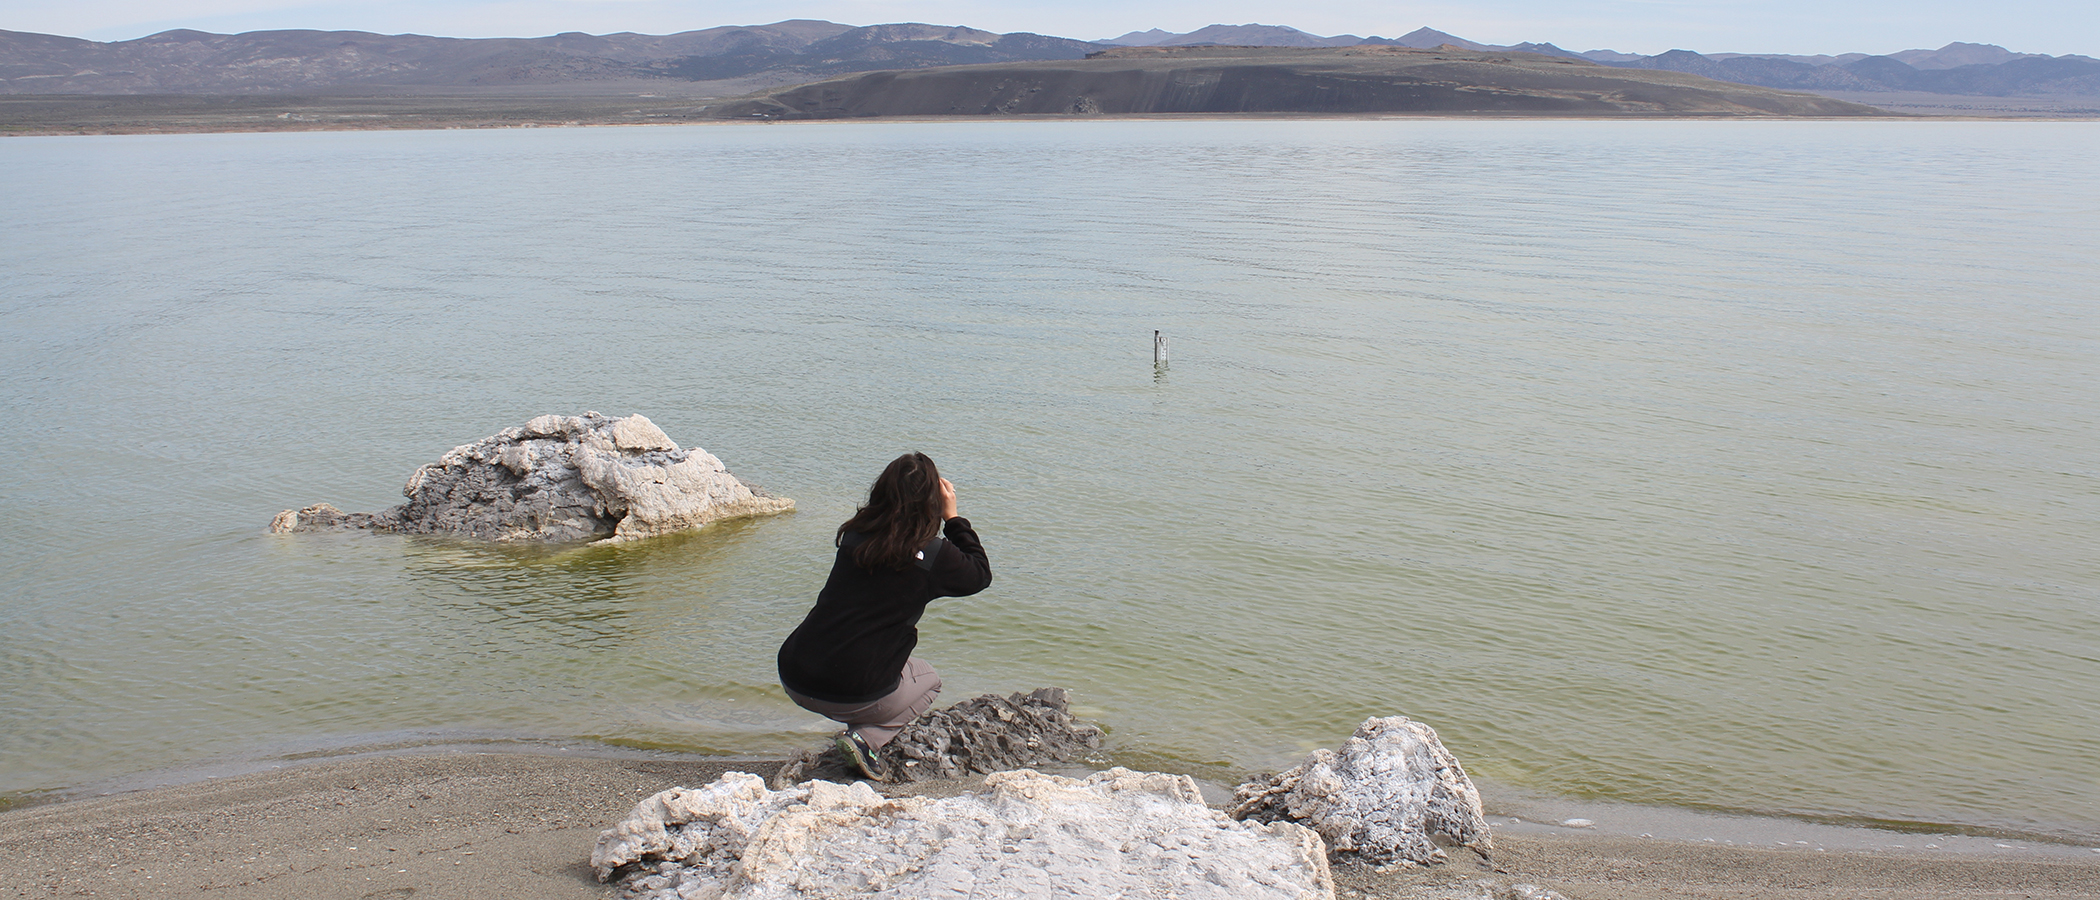
Top photo by Robbie Di Paolo.