At the end of the wettest January in the 29-year record for Lee Vining, how do Mono Basin season totals for precipitation and snowfall compare to other years? The season precipitation total (since October) of approximately 15.84 inches of water is among the wettest years recorded since 1989. It is the second-wettest year to date (1997 was the wettest) that we’ve recorded in 29 years as of the end of January.
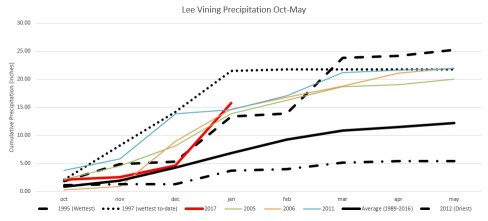
At Cain Ranch, five miles south of Lee Vining and more representative of the precipitation that falls on Mono Lake itself, the 2017 seasonal total of 9.44″ to date is sixth-wettest in 86 years. For both Cain Ranch and Lee Vining, these totals fall into the wettest 7% of years.
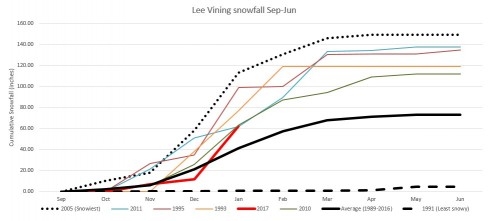
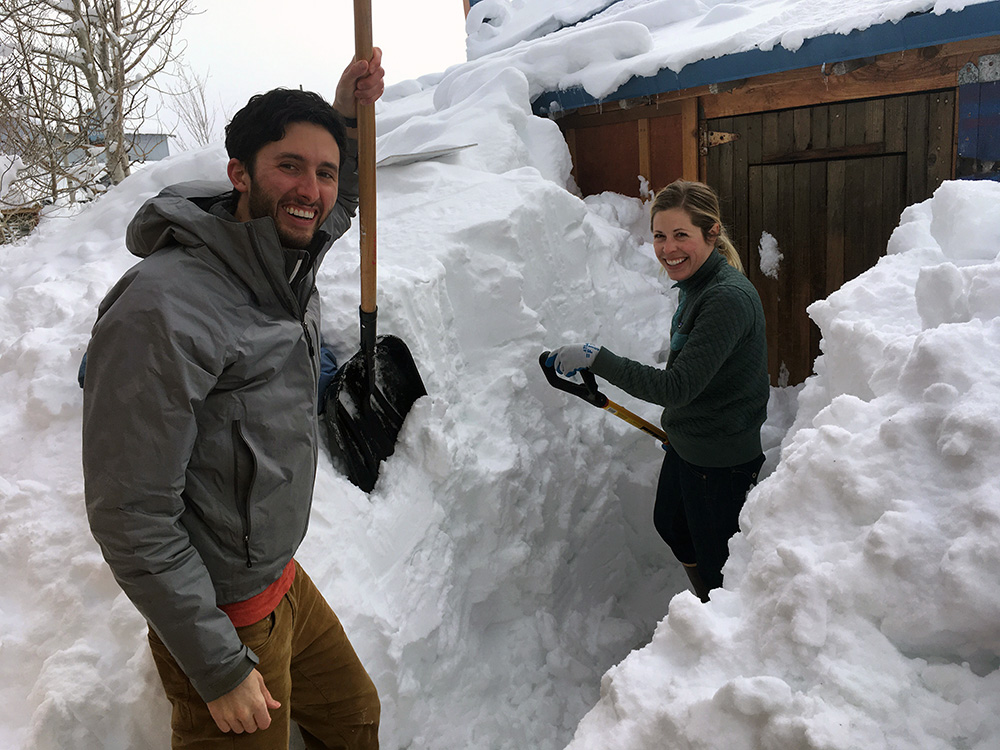
For snowfall in Lee Vining, Mono Lake Committee staff have measured approximately 51 inches in January (fifth-snowiest in 29 years) and 62 inches so far this season (seventh-snowiest in 29 years as of the end of January). In the graph below, the five years (in the 29 year record) with 100+ inch season totals are shown for comparison. This to-date season total falls into the wettest 24% of years. Due to warm storms, the snowfall depth totals below 7,000 feet are not as remarkable as the precipitation totals, although for those of us shoveling it, the weight is as important as the volume—a possible density record (hard to calculate without knowing how much rain runoff occurred) makes it a remarkable year for backaches and sheer exhaustion. And just to the south, Mammoth Mountain has had record January snowfall—snowier than any month on record. Snow surveys at the higher elevations next week should shed a lot of light on how the Mono Basin snowpack compares to nearby areas and previous years.
A rise in Mono Lake this year is now looking likely. How much might Mono Lake rise? We will wait for the February 1 snow surveys before diving into that question further. However, with a repeat of 1997 weather conditions—the driest February through May on record, with only 0.25″ inch of precipitation in Lee Vining—Mono Lake might see less than a foot rise from its current level of 6,377.55 feet by mid-summer. On the other hand, forecasters are talking about the possibility for more atmospheric rivers hitting California in February, which would be great for Mono Lake.
The charts on precipitation are graphically interesting. They would be more interesting if each had a key with it to identify the lines.
The snowfall totals are great! I can hardly wait to visit Mono and one of my favorite places…the Eastern Sierra! Glad you folks are there embracing and supporting those natural wonders!
Thanks,
Don
Jane – the key is at the bottom of each.
you have to squint.
Jane: try right-clicking on the graph, then choose ‘Open in New tab — IN the new tab, you’ll be able to see, in larger size,the key will be quite clear!( yea, it’s practically invisible unitil you do that!!! ;-) )
MK
Hi folks (Jane, Sally, Michele)—Simply click on the photos to see them larger. Right-click, regular-click, either one works. That works with all the photos we publish on here on the Mono-logue, and it’s especially helpful for the graphs!